

Parts of south London could be submerged underwater in less than 30 years, according to a climate change study.
Large areas of the city could be flooded, and the riverbanks completely changed, if research by Climate Central is correct.
The data comes from leading scientists and journalists who research climate change and its impact on the public.
They have created an interactive map, using current predictions to show which areas of London and the rest of the country could be lost to rising sea levels by 2050.
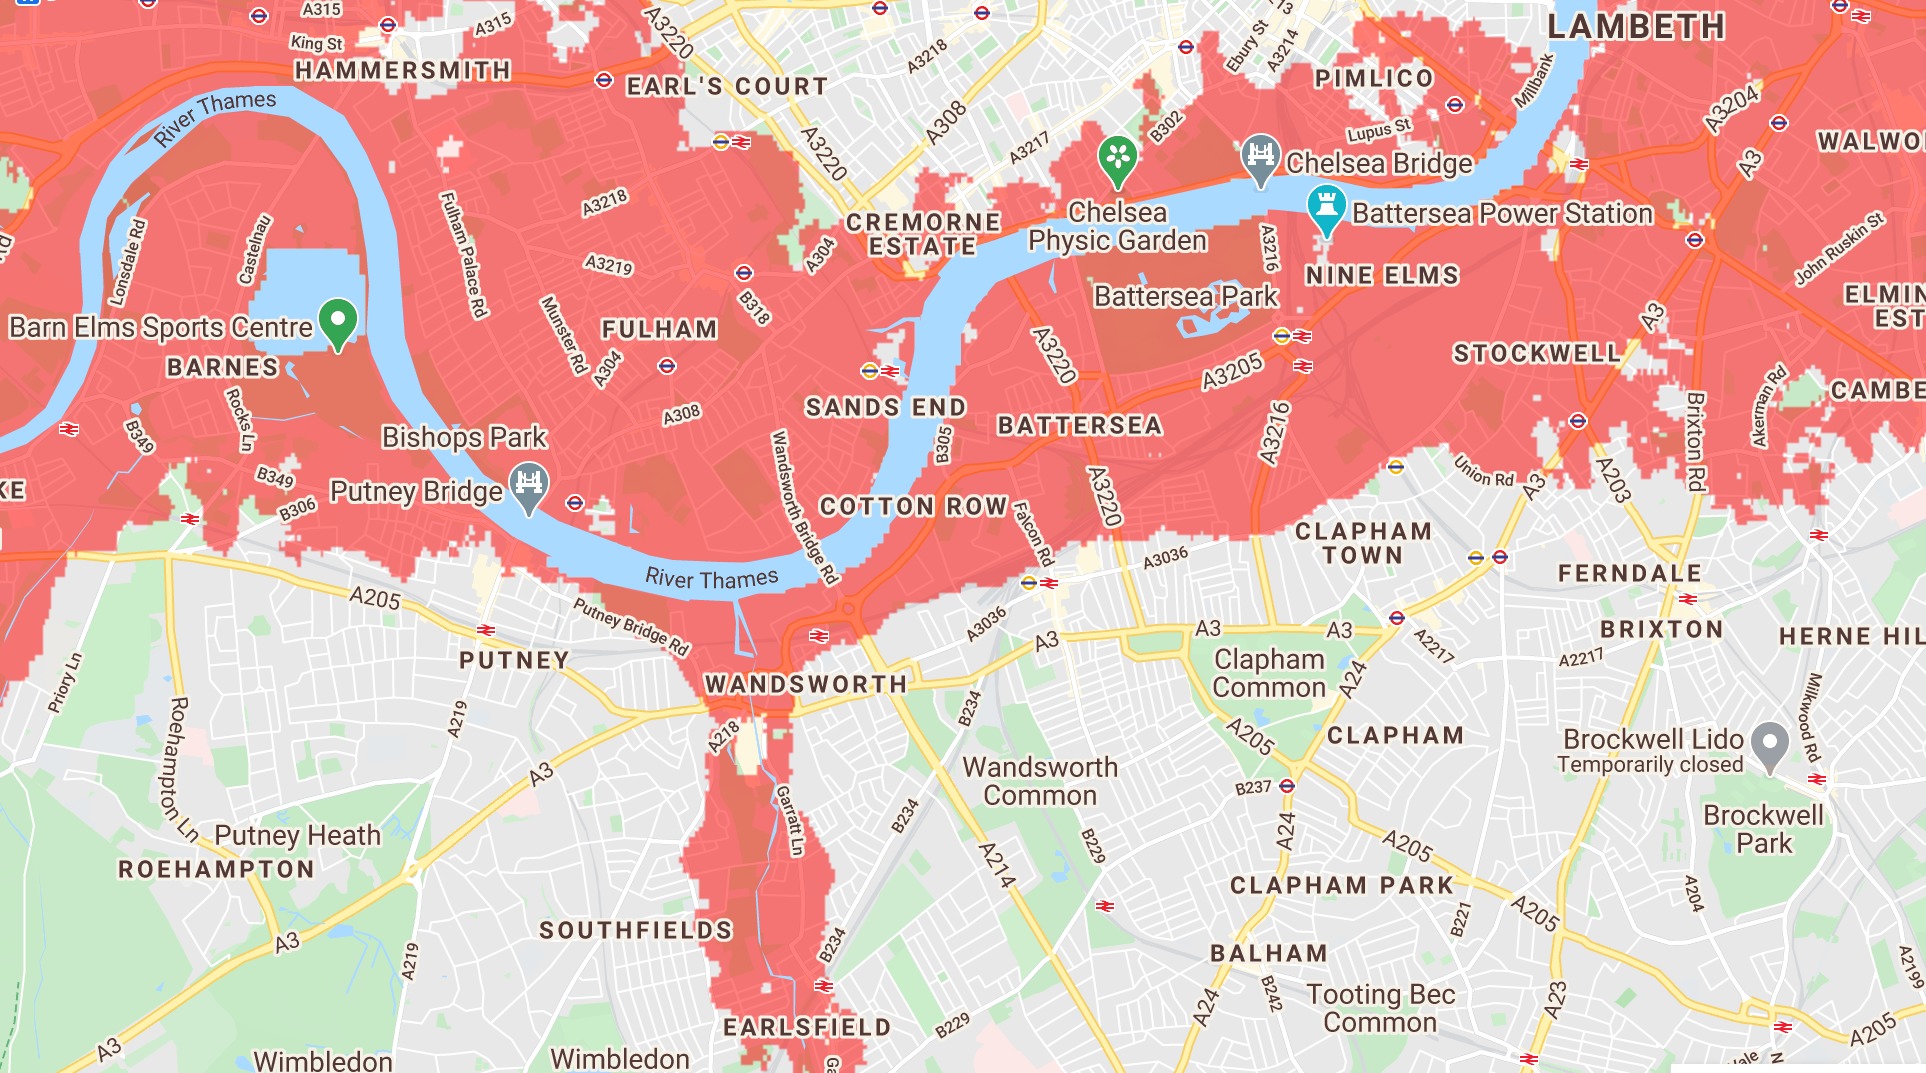
How parts of south London appear on the map. Picture: Climate Central
The map shows that swathes of Wandsworth, including bits of Battersea and Nine Elms, could underwater in nearly 30 years.
Battersea Park and Battersea Power Station would be fully submerged.
Meanwhile, houses bordering the River Wandle in Earlsfield and Summerstown would be affected.
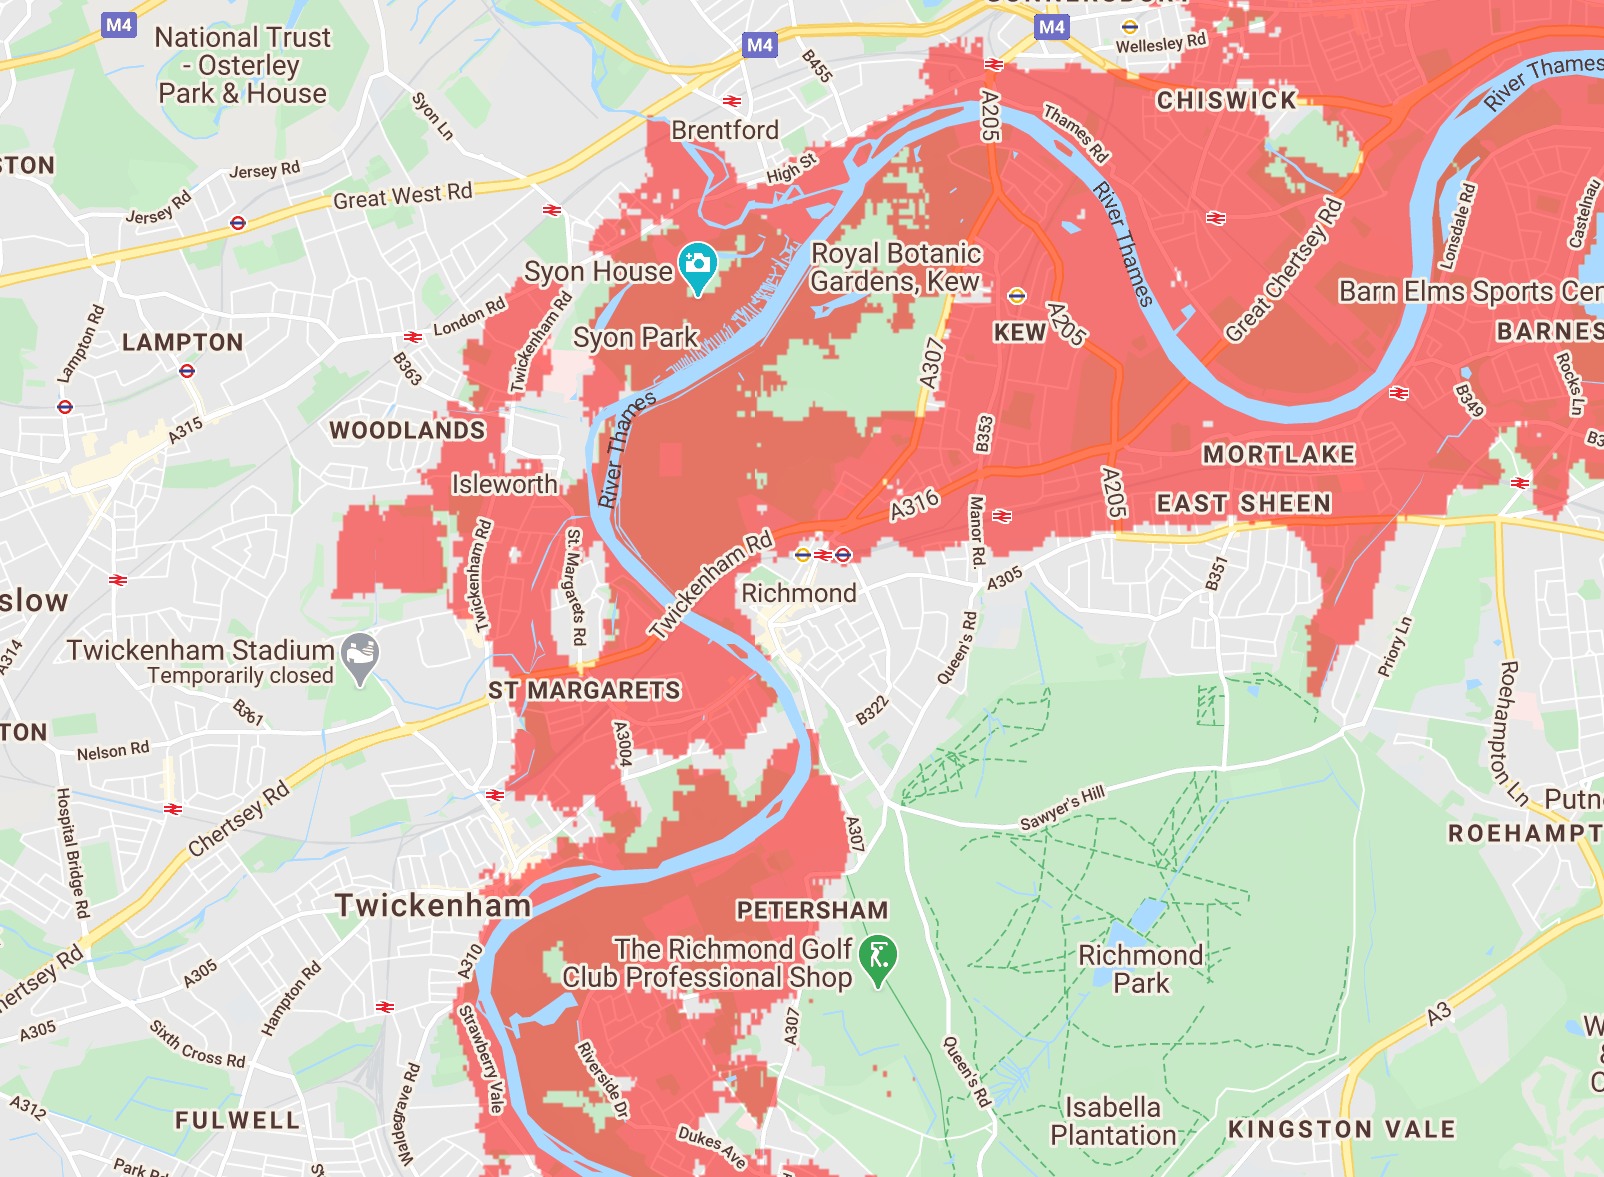
How parts of south London appear on the map. Picture: Climate Central
To the west, much of Richmond-upon-Thames would be flooded, with whole towns including Barnes, Mortlake and Kew lost.
Though luckily a small section of Kew Gardens and the historic Hampton Court palace would remain dry.
If the climate change predictions are accurate, the River Thames would spill into St Margarets, Petersham and Twickenham.
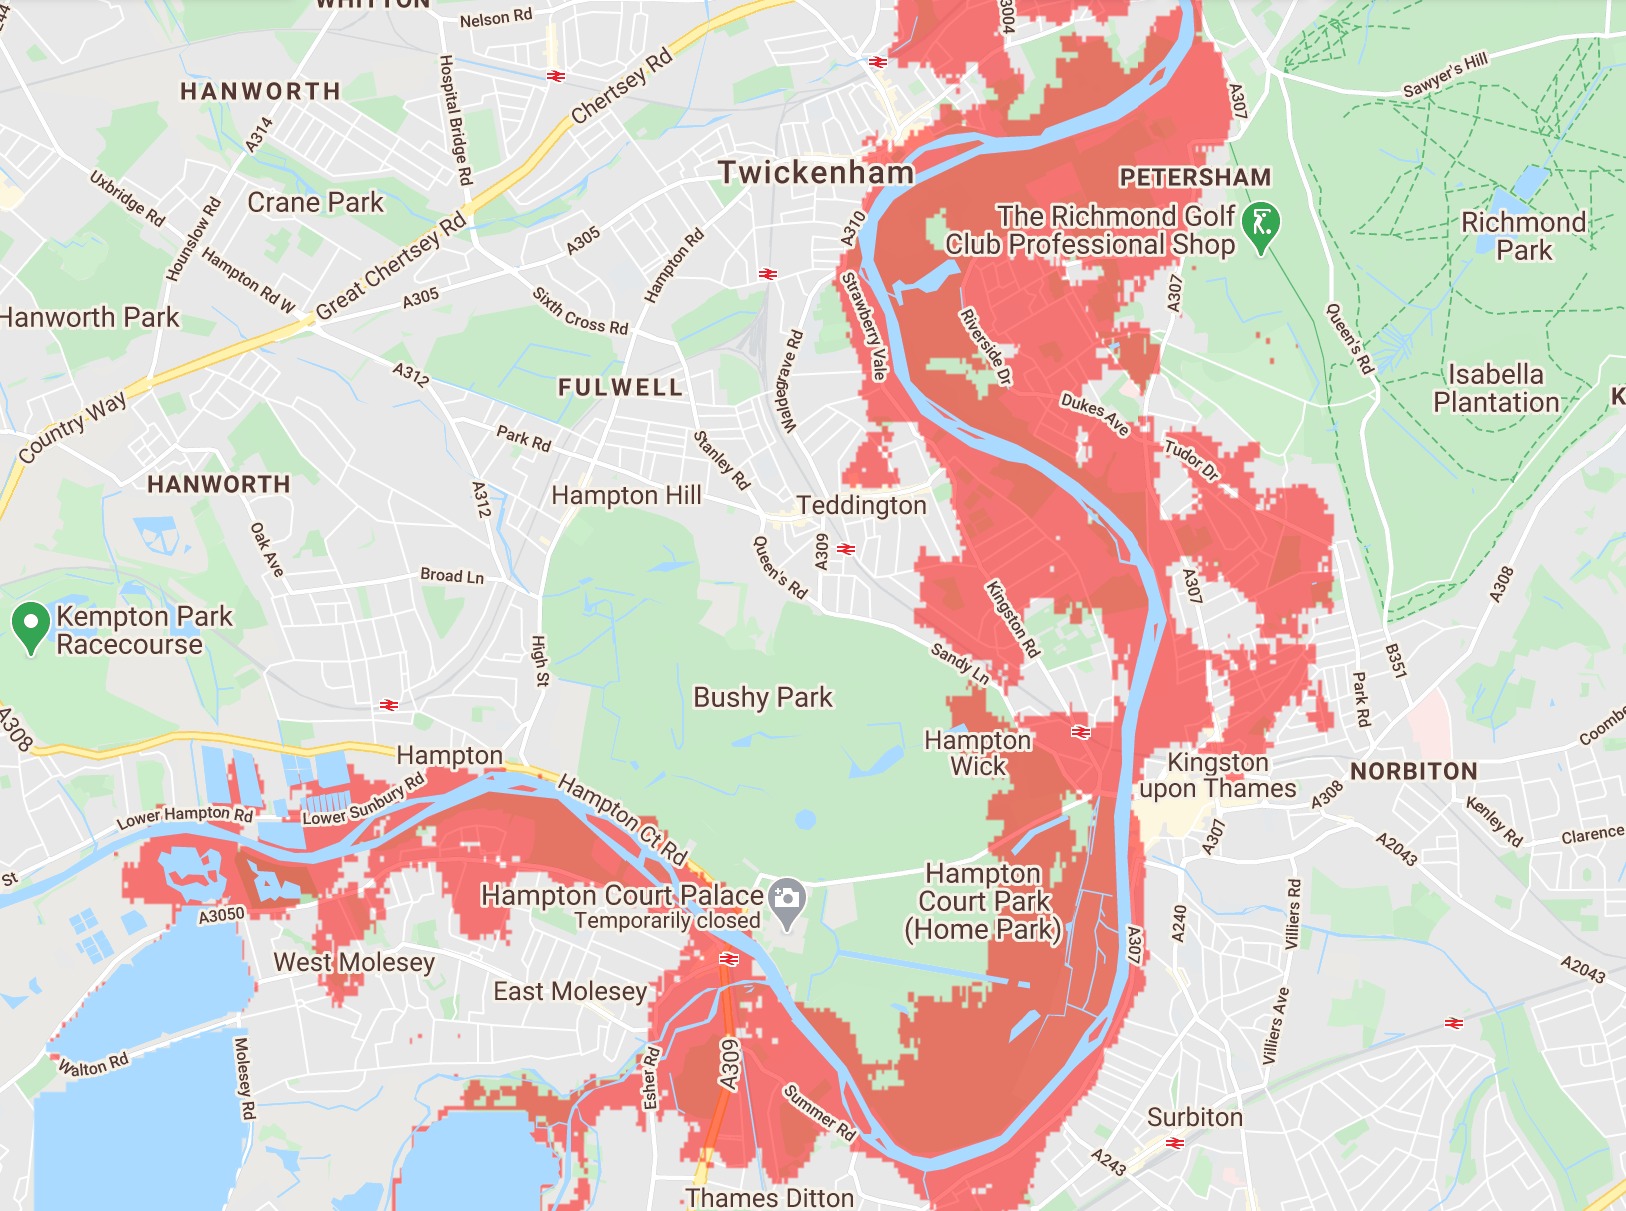
How parts of south London appear on the map. Picture: Climate Central
Moving towards Surrey the projections look less daunting.
Kingston and Surbiton come off largely unscathed, apart from areas closest to the riverbank.
Areas away from the Thames, such as Epsom and Chessington look normal.
However, Climate Central admits the calculations that have led to fears of a nightmare scenario include "some error".
It says: "These maps incorporate big datasets, which always include some error. These maps should be regarded as screening tools to identify places that may require deeper investigation of risk."
The maps have been based on "global-scale datasets for elevation, tides and coastal flood likelihoods" and "imperfect data is used".
Somewhat comfortingly, Climate Central adds: "Our approach makes it easy to map any scenario quickly and reflects threats from permanent future sea-level rise well.
"However, the accuracy of these maps drops when assessing risks from extreme flood events.
"Our maps are not based on physical storm and flood simulations and do not take into account factors such as erosion, future changes in the frequency or intensity of storms, inland flooding, or contributions from rainfall or rivers."
But it adds: "Improved elevation data indicate far greater global threats from sea level rise and coastal flooding than previously thought and thus greater benefits from reducing their causes."
It should be noted that these are only projections.


Comments: Our rules
We want our comments to be a lively and valuable part of our community - a place where readers can debate and engage with the most important local issues. The ability to comment on our stories is a privilege, not a right, however, and that privilege may be withdrawn if it is abused or misused.
Please report any comments that break our rules.
Read the rules hereLast Updated:
Report this comment Cancel