

Hundreds of burglaries were reported in Wandsworth for a single month, and the wards where these crimes were most flagged up to police have now been revealed.
The latest figures recorded by the Metropolitan Police show that 249 of the incidents were reported in the borough for the month of January (the most up to date figures).
The statistics are broken down into 14 categories, ranging from arson, to possession of weapons, to drugs.
For the 21 different policing boroughs there isn't much of a difference when it comes to burglaries though.
East Putney, Fairfield and Nightigale wards all had the most of these particular crimes with 17, while Roehampton saw the fewest with just 6.
In terms of percentage it looked quite the same.
Burglaries in East Putney accounted for 18.2% of its total reported crimes, ranking at the top of the list.
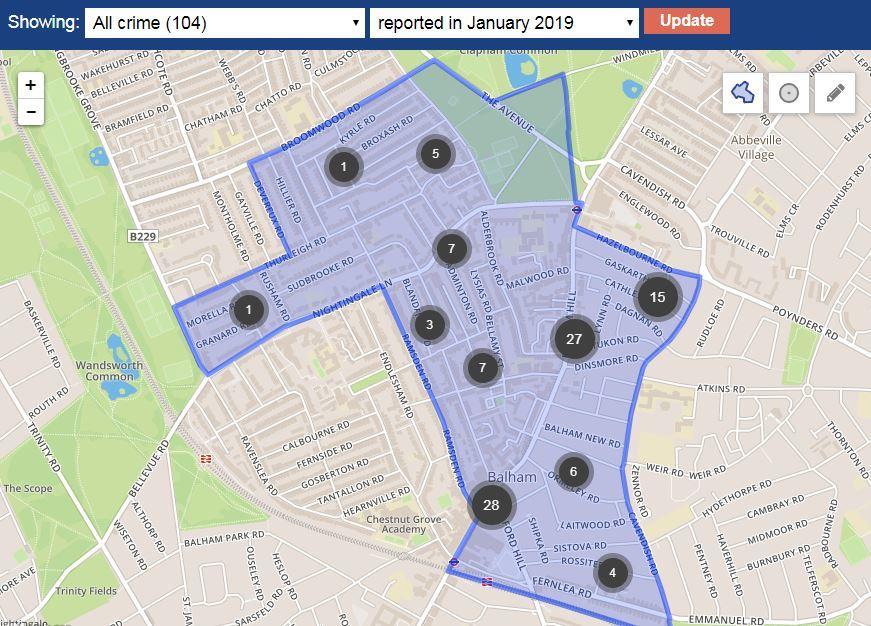
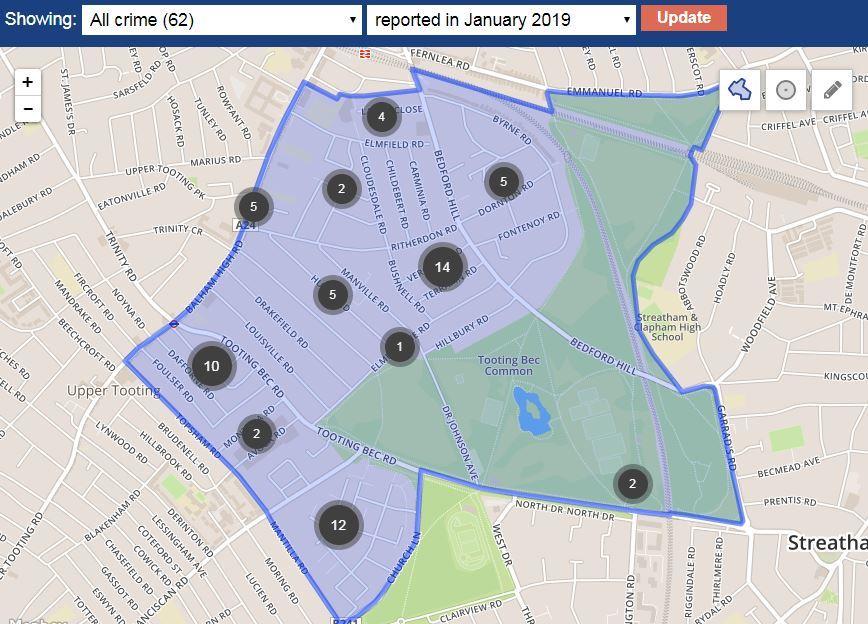
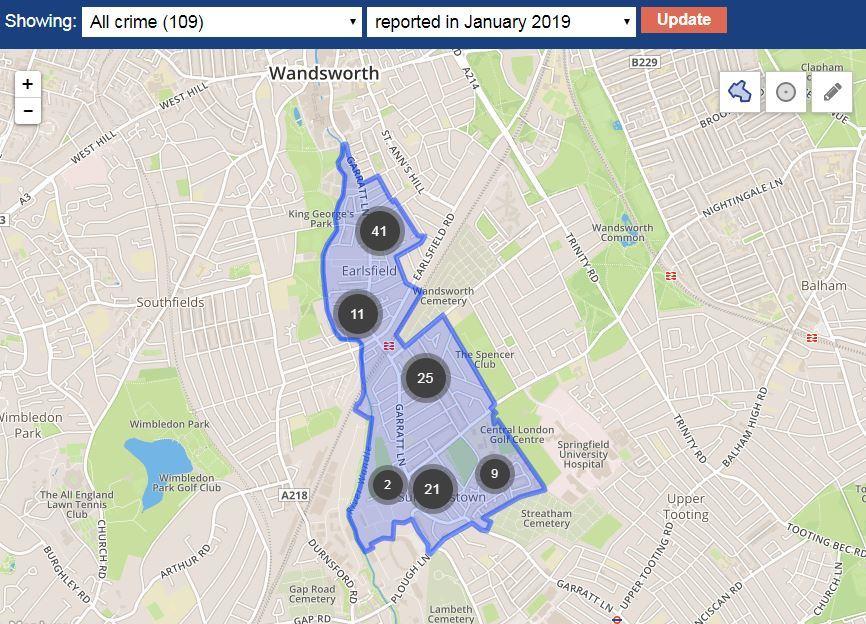
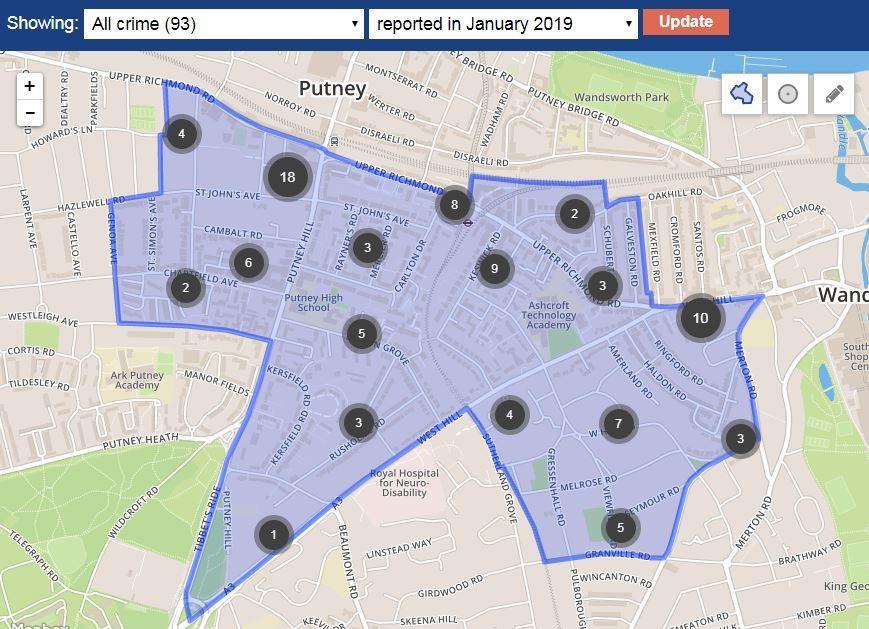
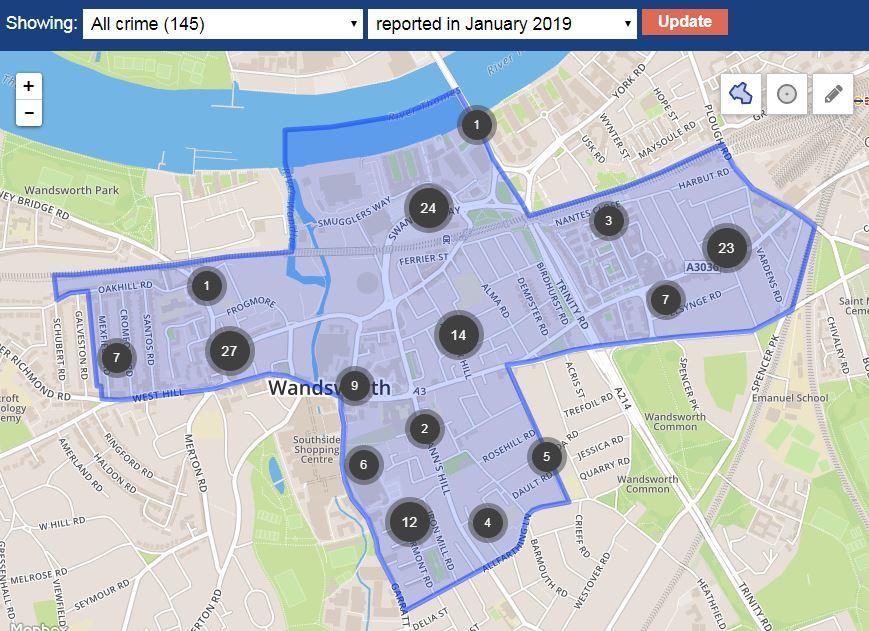
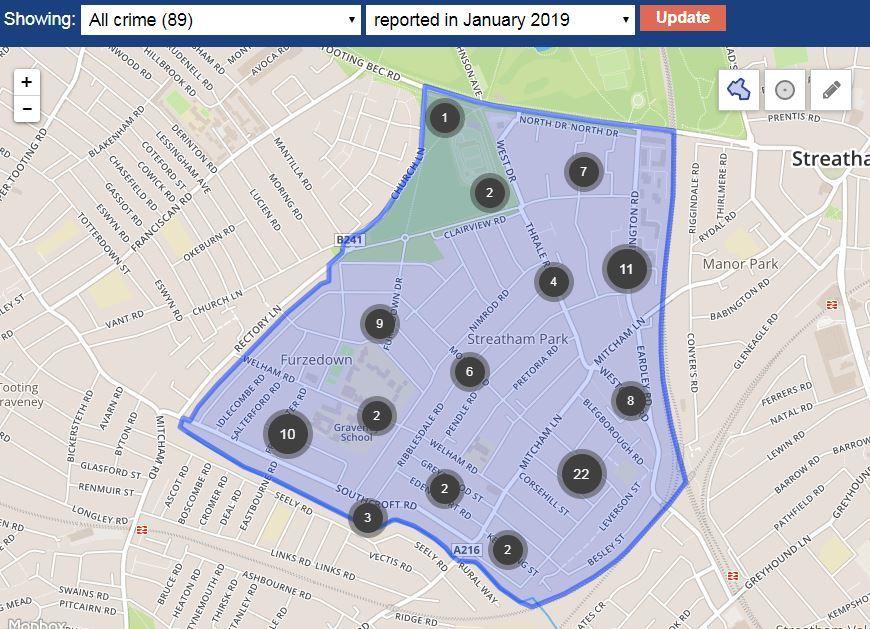
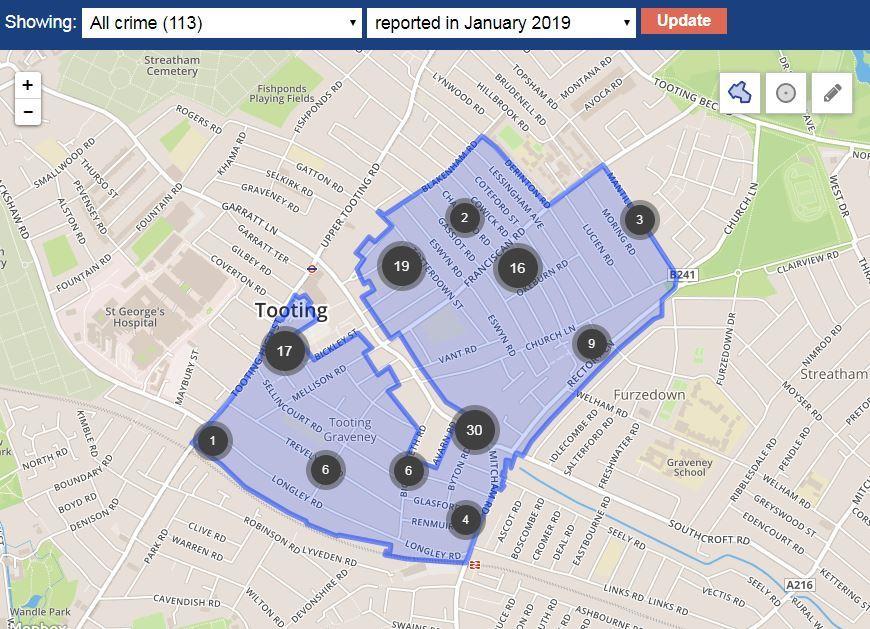
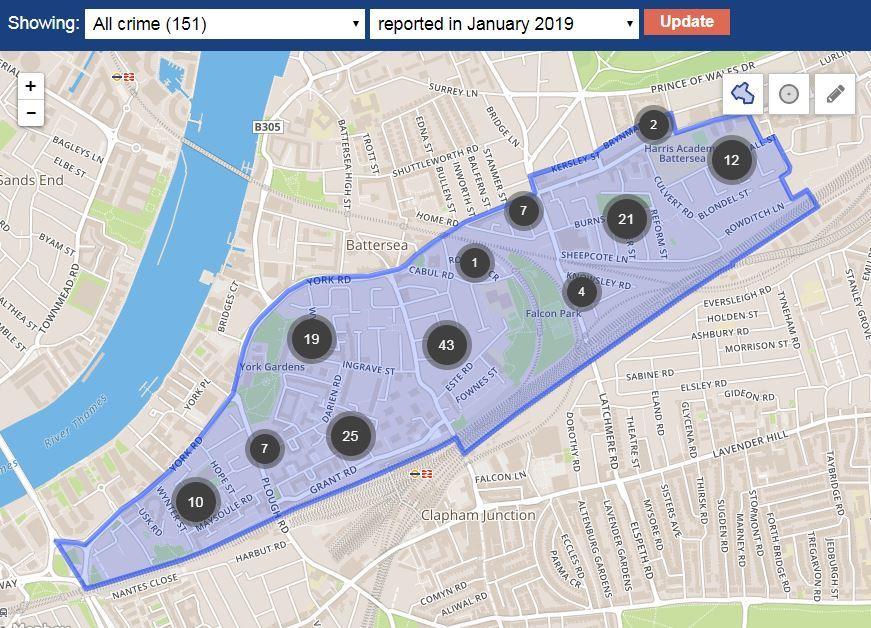
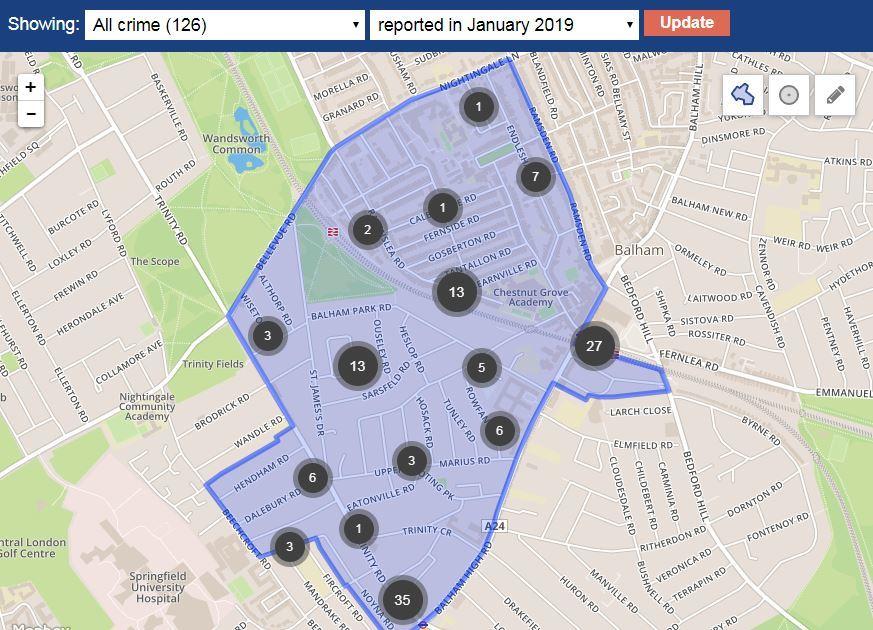
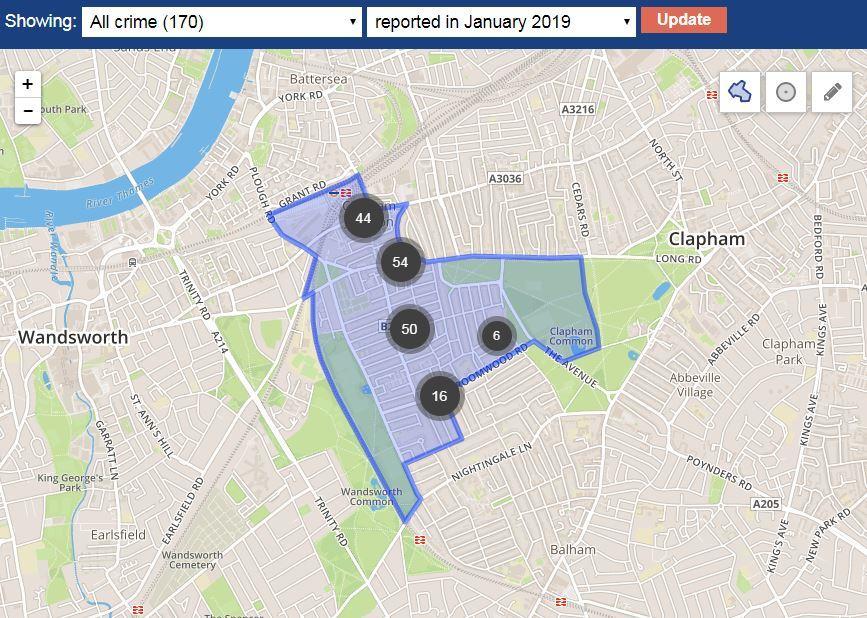
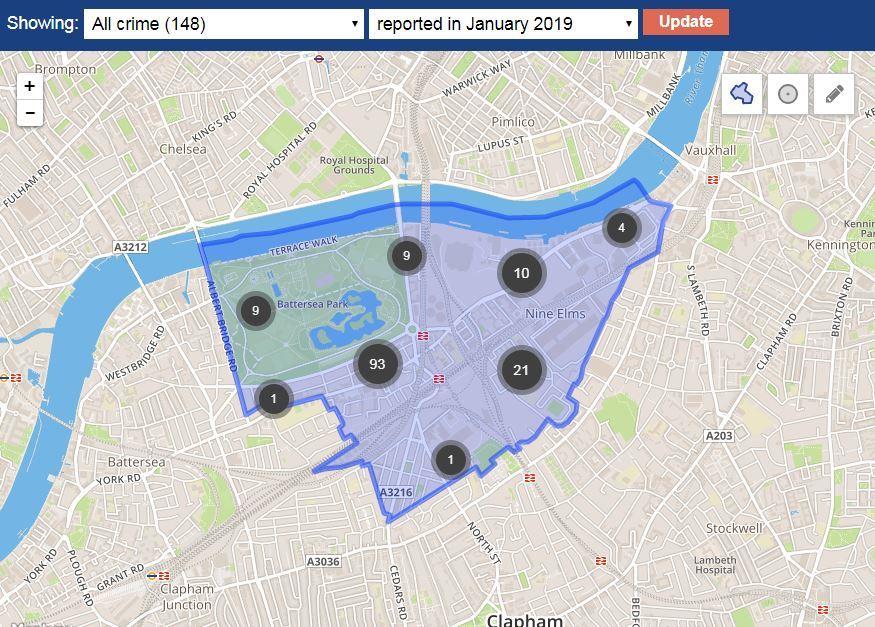
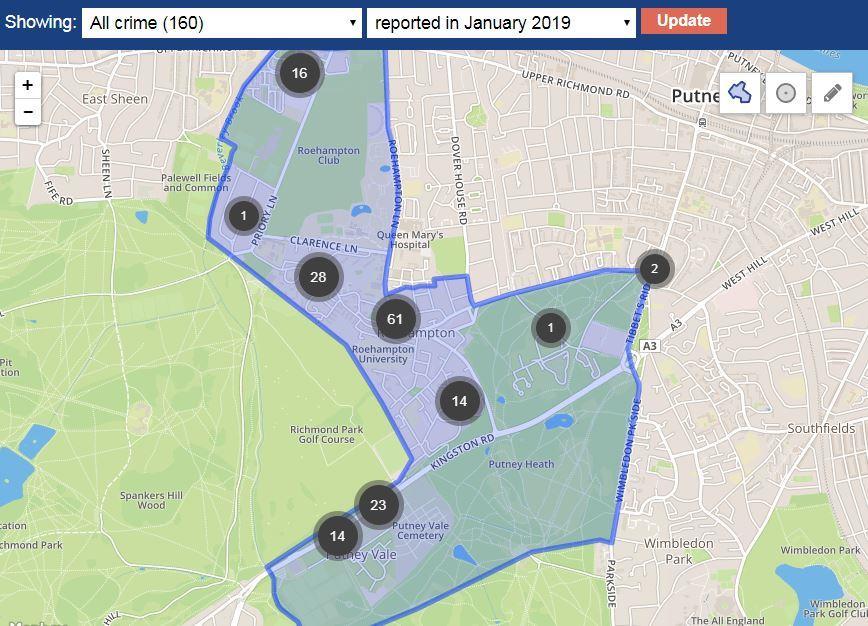
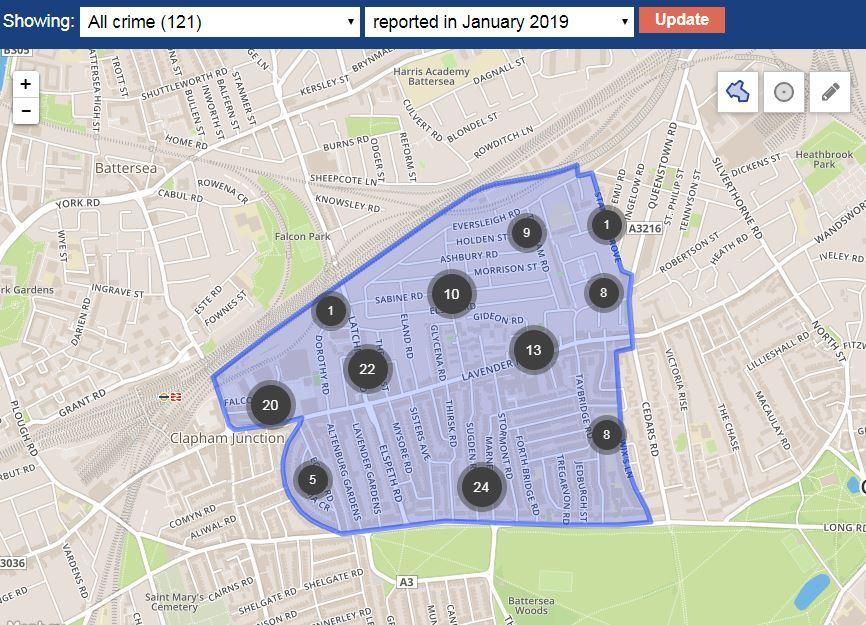
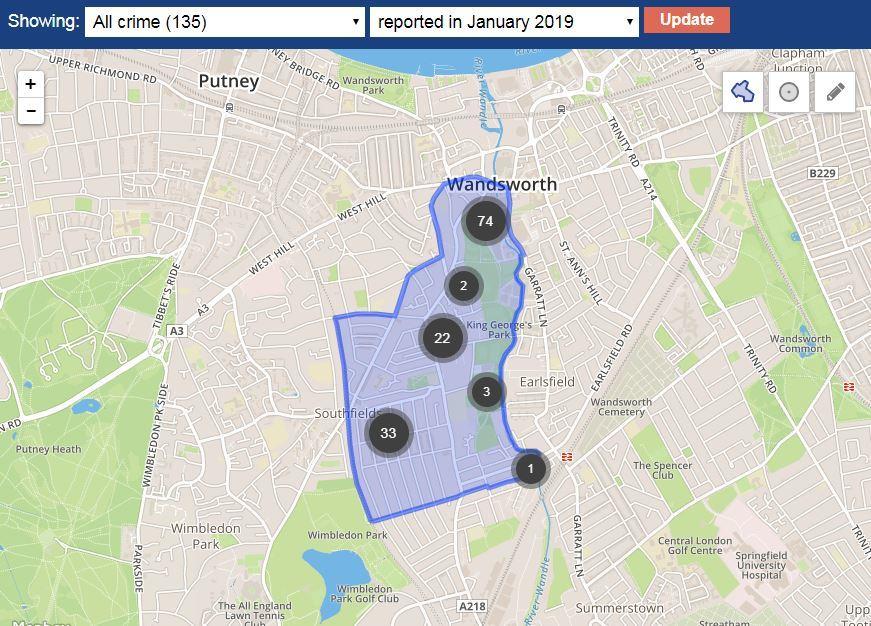
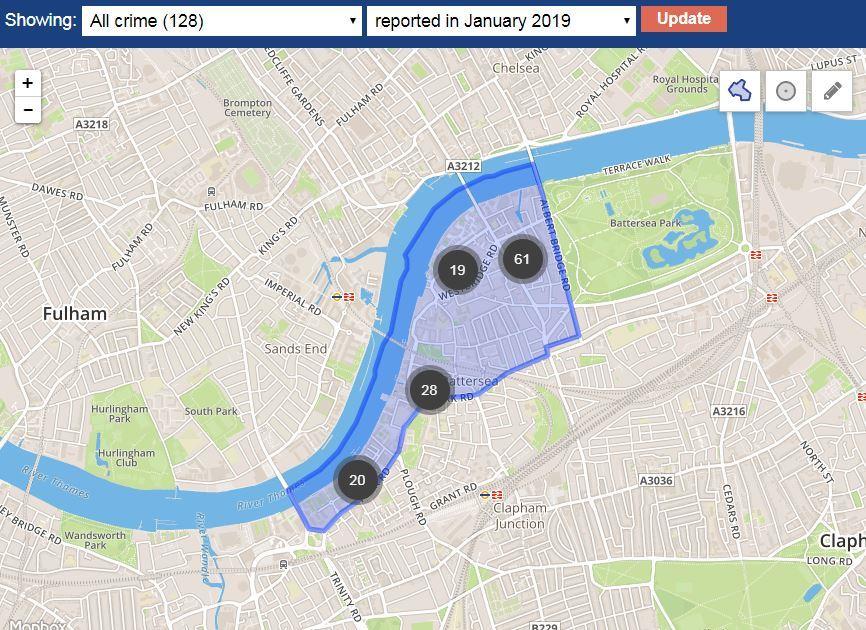
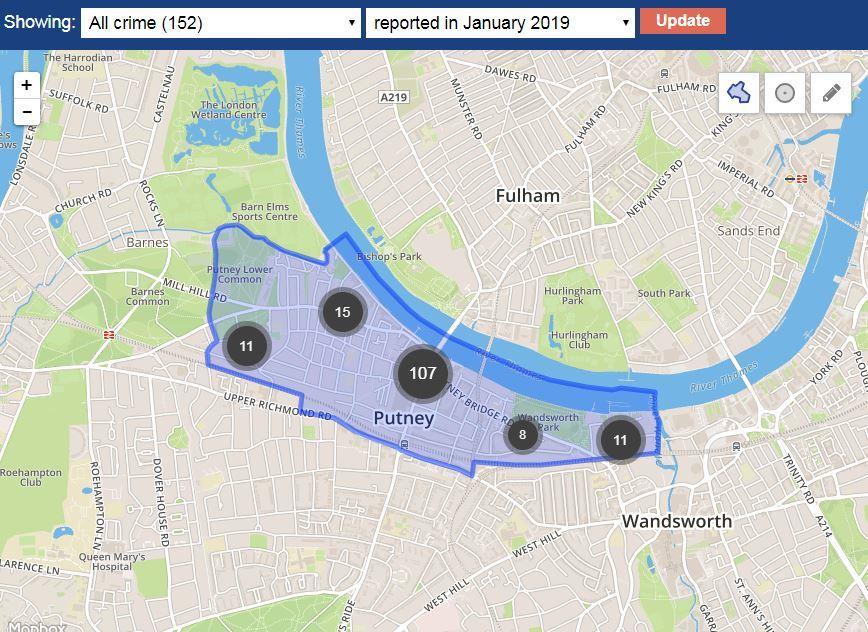
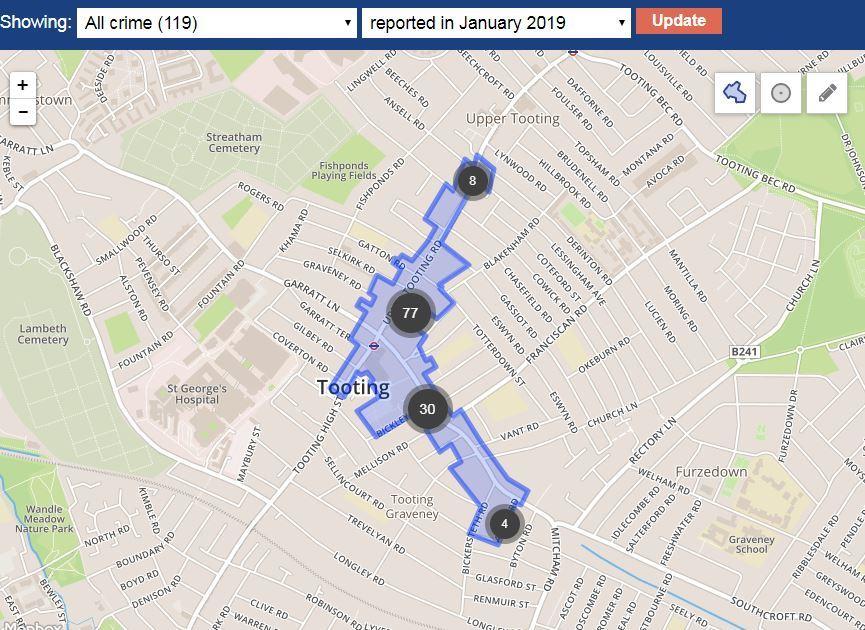
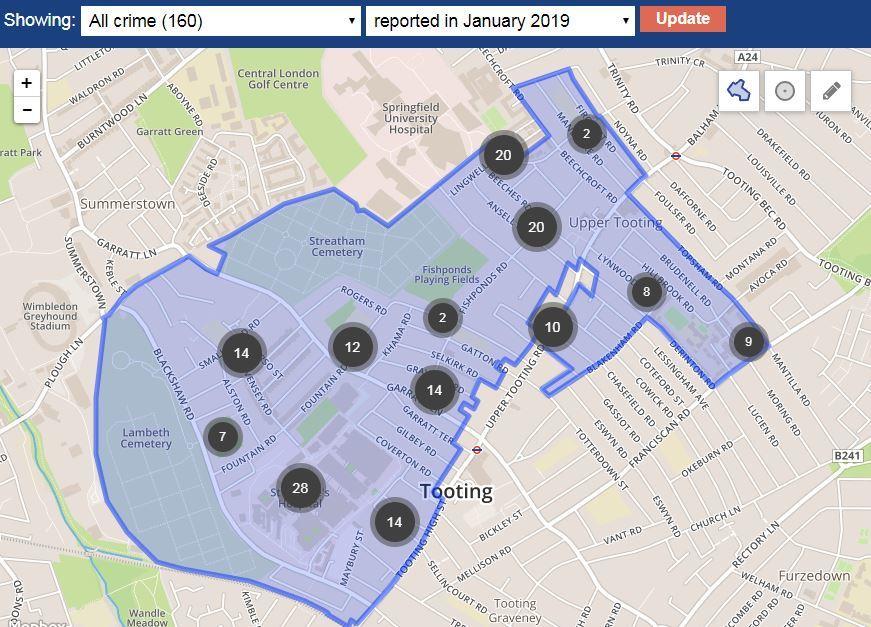
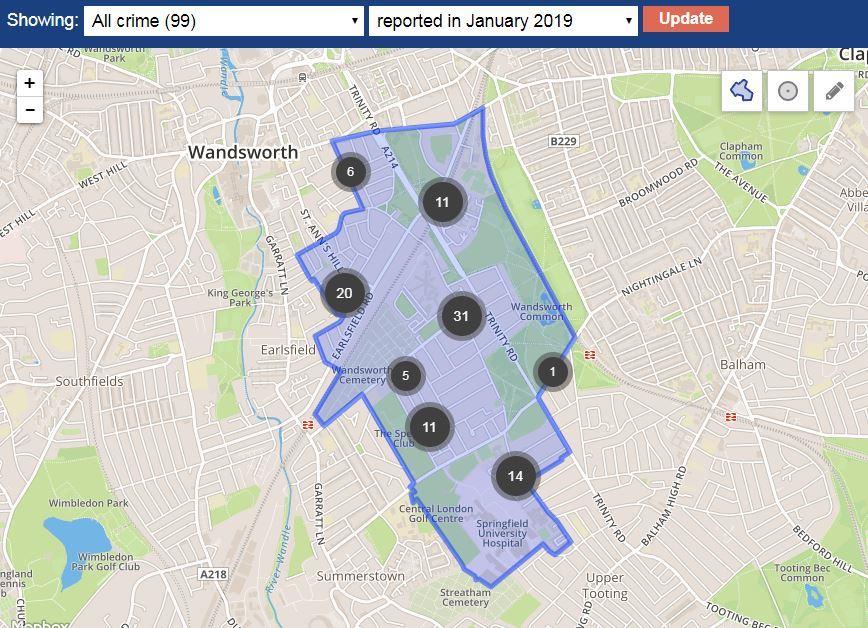
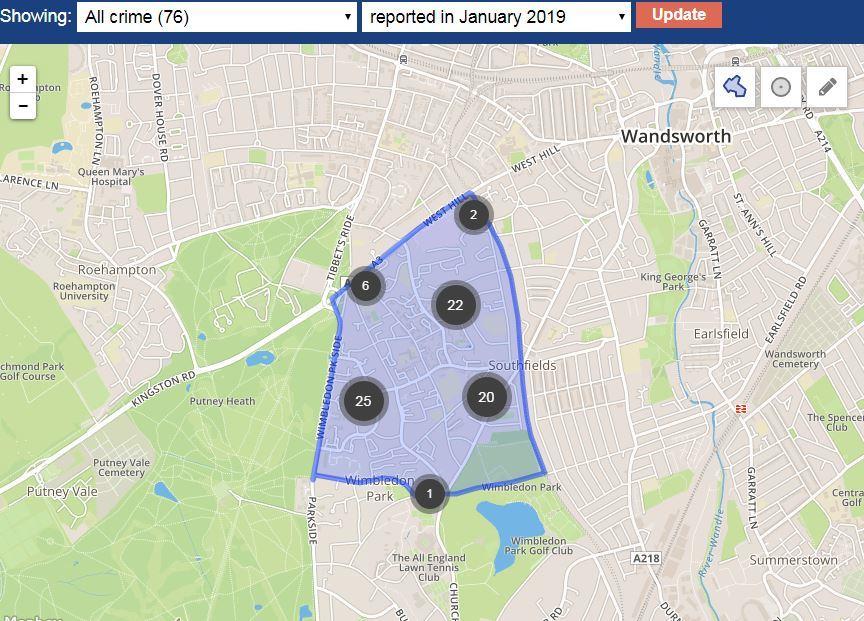
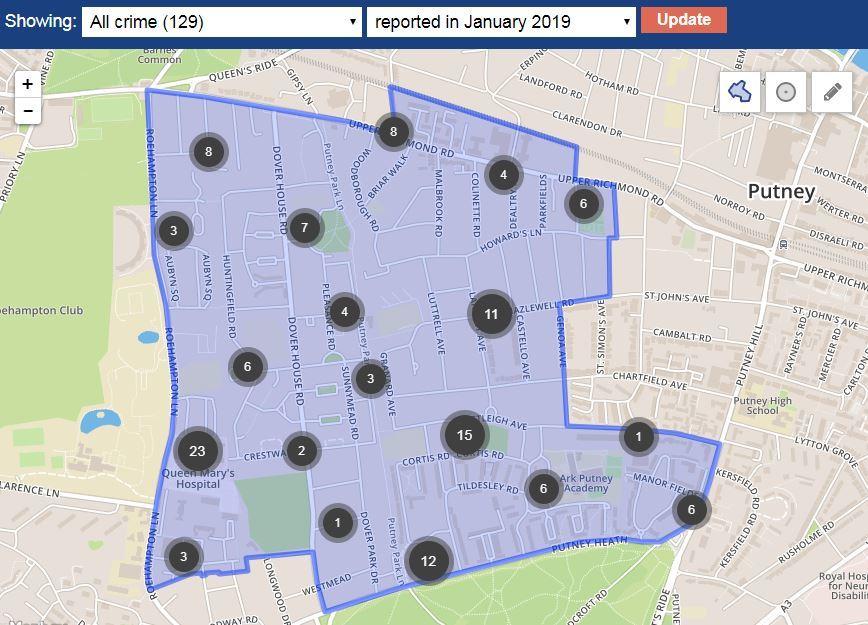
Click on the photos above to browse through the total reported crime numbers for each Wandsworth police ward borough for January and also where in those areas the offences took place.
Below is a breakdown of every police ward in Wandsworth, ranked in order of the percentage, with total number of burglaries also listed:
- East Putney – 17 – 18.2%
- Wandsworth Common – 15 – 15.1%
- Bedford – 9 – 14.5%
- West Hill – 11 – 14.4%
- Nightingale – 17 – 13.4%
- Southfields – 18 – 13.3%
- Balham – 13 – 12.5%
- West Putney – 16 – 12.4%
- Fairfield – 17 – 11.7%
- Furzedown – 10 – 11.2%
- Tooting – 16 – 10%
- Earlsfield – 10 – 9.1%
- St Mary’s Park – 11 – 8.5%
- Northcote – 13 – 7.6%
- Tooting Town Centre – 9 – 7.5%
- Latchmere – 11 – 7.2%
- Graveney – 8 – 7%
- Shaftesbury – 7 – 5.7%
- Queenstown – 8 – 5.4%
- Thamesfield – 7 – 4.6%
- Roehampton – 6 – 3.75%


Comments: Our rules
We want our comments to be a lively and valuable part of our community - a place where readers can debate and engage with the most important local issues. The ability to comment on our stories is a privilege, not a right, however, and that privilege may be withdrawn if it is abused or misused.
Please report any comments that break our rules.
Read the rules hereLast Updated:
Report this comment Cancel